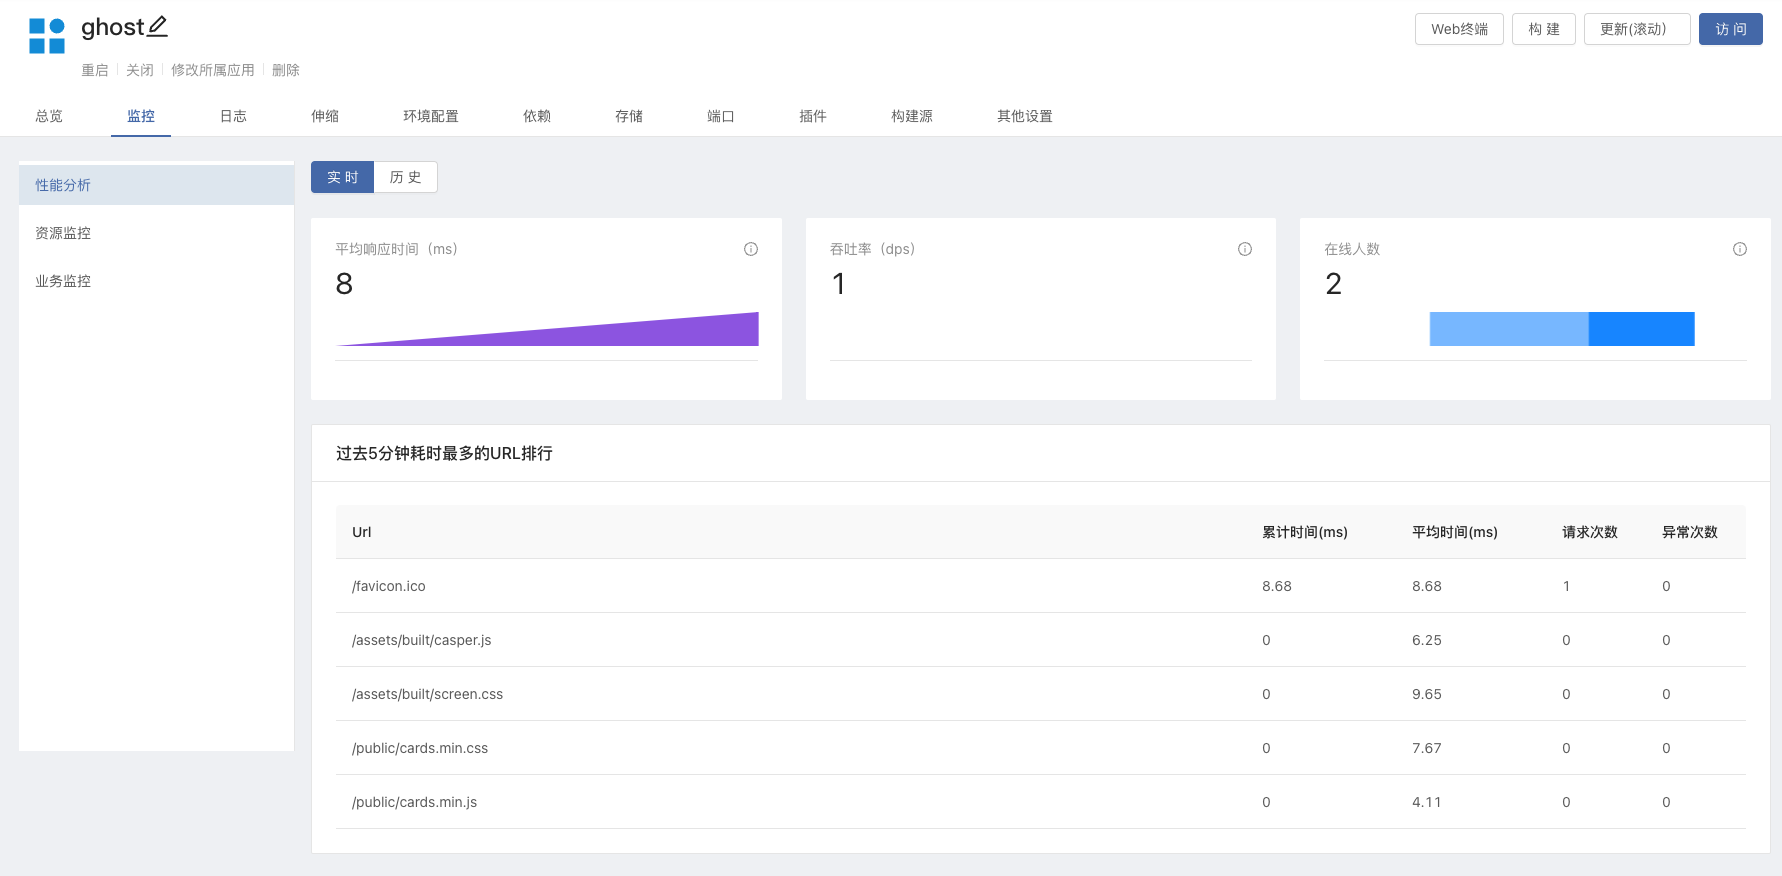
performance analysis
The real-time performance analysis function of the component is completed by enabling the performance analysis plug-in of the component. Rainbond currently provides performance analysis plug-ins that support HTTP protocol and Mysql protocol by default for users to use.
Component performance analysis
We use three metrics to measure the performance of all types of:
- Response time
Response time is also called delay, and components generally work in the application layer of network communication, such as http, mysql, redis, grpc, etc.The time it takes for a component to process a client request is the response time.If we measure it from the dimension of network packets, it is the time between the first packet of the request packet and the first packet of the response packet.
- Throughput
Throughput, also known as traffic, is the number of times a component handles requests per unit of time.
- Error rate
Errors include explicit errors (such as HTTP 500 errors) and implicit errors (such as HTTP returns 200 but the business is wrong), here we mainly focus on explicit errors, each communication protocol has standard error types, such as mysql has query Statement error.The error rate is normally closely related to the saturation of the component.
To sum up, we have two ideas when implementing performance analysis. One is that in the ServiceMesh network, the agent will report three types of indicators according to different protocols. The second is the currently used method. The performance analysis plug-in bypasses the way to monitor the network communication of the component, so as to directly analyze the above indicators of the component.
Monitoring effect
The performance analysis data is persistently stored in the Rainbond monitor component for client query.In the component monitoring page, in addition to displaying the monitoring historical data, we also display the request status of http and mysql in real time, such as the execution status of the sql statement requested by mysql.This provides a direct guide for users to refine and optimize.

Steps
Install the performance analysis plug-in and enable it.

After the plugin is activated, update/restart the component to take effect.
More protocol support
In the TODO list, we plan to support the performance analysis of the grpc protocol, redis protocol, and mongodb protocol.